Brrr! It’s cold outside! Winter weather can be brutal, and it’s not a fun time to work outdoors in these low temperatures. But it is an excellent time to sit down and analyze your data from the previous year!
By now, your PFR book should have arrived, and hopefully, you have earmarked some of the studies you want to learn more about or perhaps even try on your farm. By using the analytic tools with your data in FARMserver, you can better define and refine your implementation decisions for 2022.
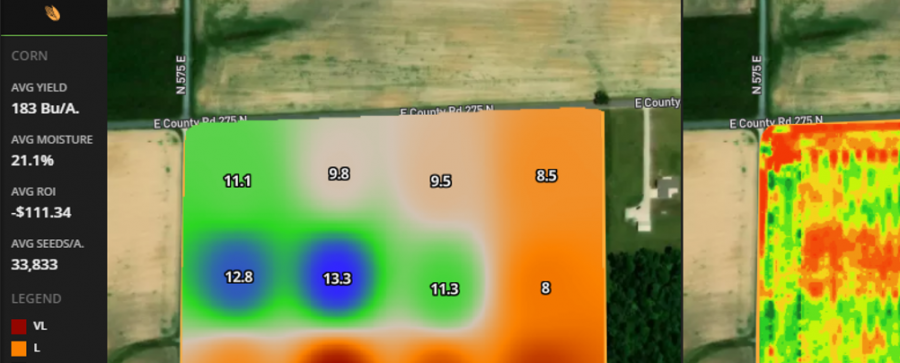
Our newly updated Query Tool is the easiest place to start when performing analytics within a field. In the bottom right corner of Field Focus, you will find the Query button. Use the circle, square, or polygon drawing tools to outline any part of your field that you want to learn more about the acres, average yield, average moisture, yield by soil type, and the yield by hybrid (if planting data is available) in that particular location.
If you had a fungicide trial or want to see the results of a side-by-side planting comparison, simply turn on those corresponding layers to help guide your query outline. Any dataset or scouting note on that field for that year is available to use as a reference layer when drawing a query area.
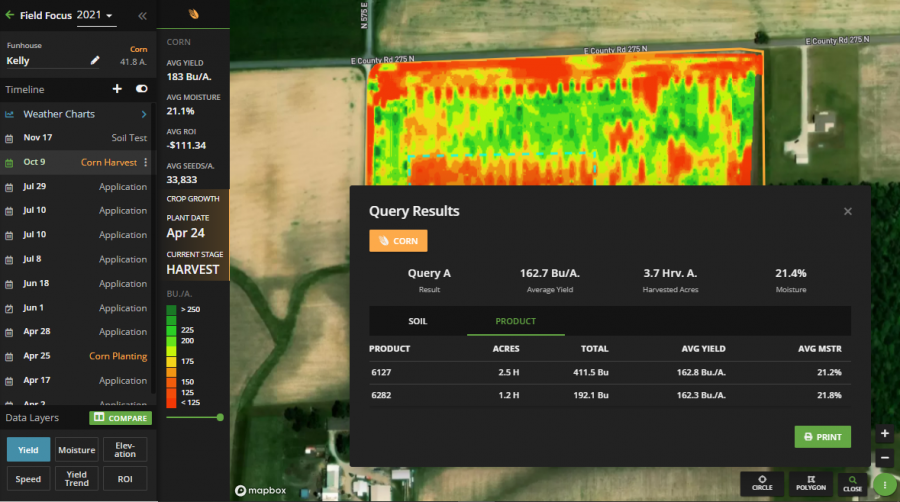
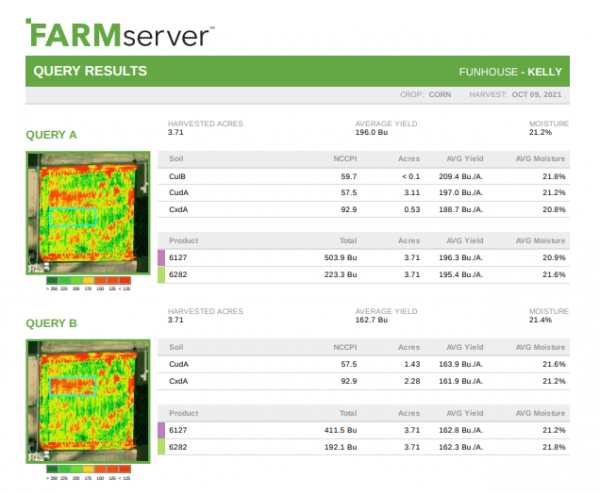
Recent updates to the Query Tool now offer farmers the ability to compare two queries side by side and print off the results. To do so, draw your first query, then close the query box and draw another query. The pop-up will display the last two queries you traced. Clicking the green “Print” button will trigger FARMserver to export the query results into a PDF that will be sent to your email for you to view, print, or forward to someone else.
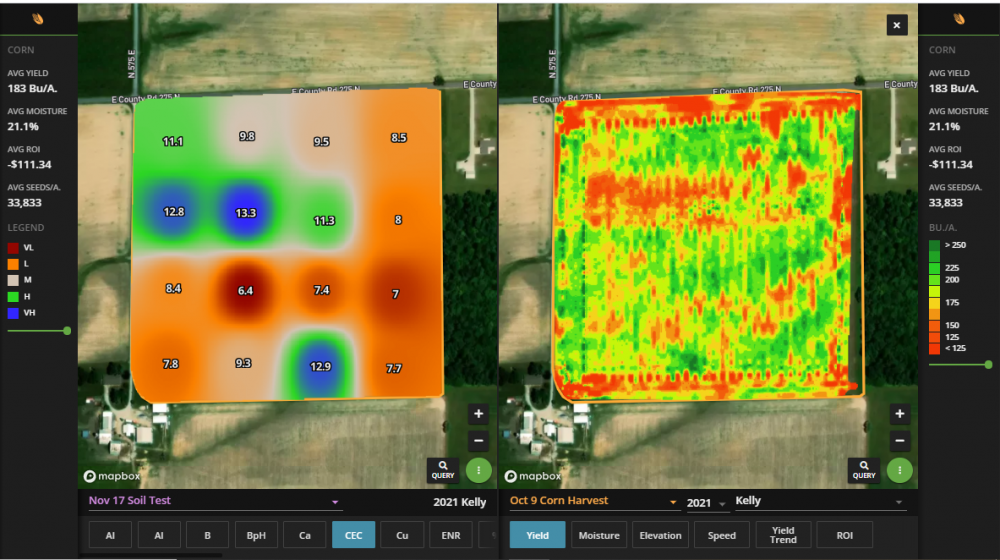
The other valuable analytic tool at the field level is the Comparison Tool. Tucked just beneath the Field Focus Timeline, the Comparison Tool allows you to compare two different layers side-by-side in one split screen visually. You can compare various attributes like planting rate vs. planting speed in the same event. Change the event and look for patterns between planting speed and the yield map. Or, change the year to compare data in different seasons, like evaluating soil test pH in 2020 vs. soil test pH in 2016, for example. Sometimes the visual comparison is all you need to make your decisions.
There are many ways to utilize the data you collect on your farm. If you need help with any of these tools in FARMserver, or are ready to create an account and get started, don’t be afraid to reach out to your local Beck’s representative for guidance.
By Sheila Downey | Regional Precision Technology Specialist