Looking ahead to the 2019 growing season, profitably should be on the mind of every farmer. Some questions that might be top of mind include: “Will it be more profitable to plant corn or soybeans? From fertilizer programs, nitrogen decisions, chemical programs, to seed, what is the magic recipe for profitably for 2019?” Knowing that every farm and field is different, there aren’t always easy answers to those questions.
A Tool to Help
The Return on Investment (ROI) Calculator Tool in FARMserver® is available to help you plan for any scenario across each farm and field. When logged in, you can choose an estimated yield goal and enter your cash rent. You can also plan for a corn or soybean crop in each individual field. A great feature of the tool is that every field entry has been preloaded with the average cost of production figures put out yearly by Purdue University, but you can edit every value to reflect your real costs. From there you can evaluate every input option to see what would be the most profitable.
Input Variables Include:
- Fertilizer/Lime
- Seed
- Nitrogen
- Herbicides
- Insecticides
- Fungicides
- Drying Cost
- Grain Hauling
- Machinery Repair
- Fuel
- Insurance
- Interest
- Other (Labor, Soil Sampling, Etc.)
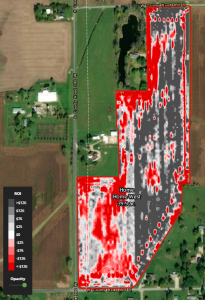
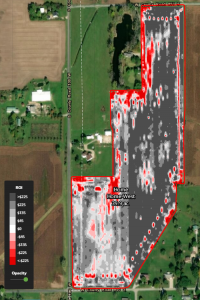
Once your yield data is imported at the end of the year, you can view a profit map of each field. This will show the acres on which you potentially lost money and also the areas where you made the most money. Using last year’s data, we created a sample scenario for changing fertilizer rates. The image above on the left is the ROI map if a farmer were to only apply crop removal fertilizer from the previous year. On the right is the ROI map if a farm were to apply crop removal fertilizer plus enough to build soil test levels. I’m not saying one way is better than the other but, in years when margins could be razor thin, a tool like the ROI Calculator can help determine if an input adjustment is profitable.
Let’s look at another scenario. The 2018 Multi-Location Practical Farm Research (PFR)® Corn Nitrogen Timing study showed that a 2×2 starter plus sidedress (160 units) at the V3 growth stage was the most effective in regards to ROI. But…what is it worth to spread your risk and have the ability to back off units to save money if needed? How many dollars per acre could be saved if you do not actually need all or any of the second or last pass? The ROI Calculator Tool allows you to run these types of scenarios to help weigh the costs or advantages.
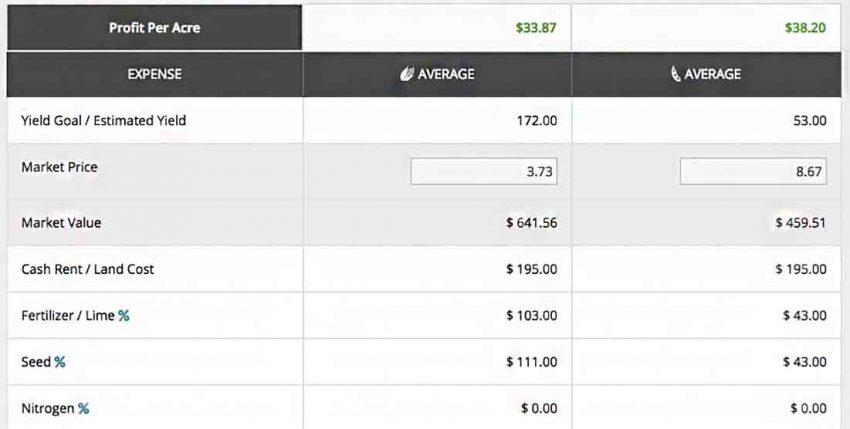
After running as many different scenarios as you want, you can examine your price per bushel. The price per bushel will show the potential breakeven market price that you’ll need to make a profit. The ROI Calculator Tool will also show what the indicated input cost was on every bushel sold.
One of the largest inputs is cash rent. With a potential 200 bushels per acre corn yield, average costs for all other inputs, and cash rent at $195.00, the cost per bushel of cash rent is around $0.98 per bushel or 30.6% of total cost. The ROI Calculator Tool can show your operation in Total Cost, Overall Cost Percentage and Cost Per Bushel.
For more information on the ROI Calculator Tool and other features, visit beckshybrids.com or farmserver.com. FARMserver is available to ALL Beck’s corn and soybean seed customers at no additional cost. If you have any questions, feel free to reach us at (317) 565-4120 or support@farmserver.com.