We all have a phone with WAY more capabilities than we know how to use. FARMserver is no different. There are MANY tools and features you won’t know are there until you really need them and someone can show you how to use them. I have highlighted the two most valuable tools post-harvest below.
Bulk Post Calibrating Yield
Post-calibrating in FARMserver can be done in two ways; by individual harvest events or by selecting multiple fields and calibrating them all at once. For someone who has all their bushels determined for each field or knows what general percentage their monitor was off, the bulk calibration option will be the quickest and most efficient way to compile this data.
Step 1: Click on your “Fields & Farm Data” tab on the left menu bar
Step 2: Select the fields you want to calibrate by checking the box to the left of the field name
Step 3: Click on the three vertical white dots to the right of the green “Upload Data” button
You will then see a screen that looks like Figure 1 below.
Once you have navigated to the post-calibration page, you can calibrate by wet weight or total bushels. The percent change will be reflected once you type in your new number. This allows you to calibrate your harvest events quickly without going into each harvest event one at a time. Calibrating these bushels will ensure your reports and ROI tool are as accurate as possible.
Compare Query Tool
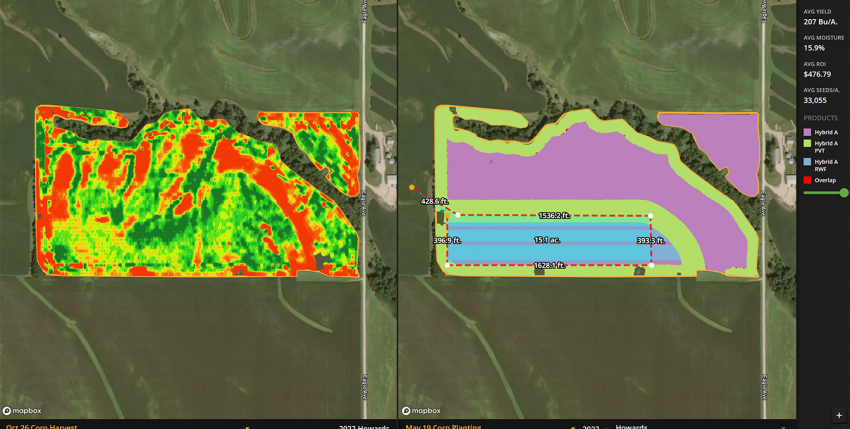
After harvest, we must try to forget what we remember from the cab of the combine. Feelings and memories can be very unreliable when making decisions about products. Using the compare tool in FARMserver allows you to look at two layers side-by-side and evaluate the query data you might want to take a closer look at. The data will have the information you need to make sound decisions next season.
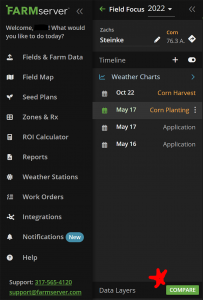
The compare button can be found in the “Field Focus” view at the bottom right of your timeline (Figure 2). Click the green “Compare” button to pull up a split screen. You can then select the two layers you want to see from a drop-down menu at the bottom of the map (Figure 3).
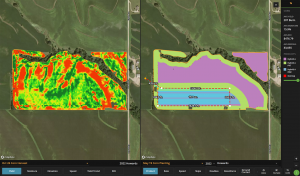
At the bottom right-hand side, there is a green circle with three vertical white dots where you will find the “query” option. Figure 3 also shows how you can draw one polygon around your test strips in your field. Once you close the polygon by double-clicking or selecting the original starting point, FARMserver will bring up an analytics box with yield by soil type and product (Figure 4).
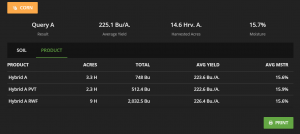
These analytics will give you the acres with an “H” behind them if they are harvested, the total bushels in each zone, the average yield, and the average moisture.
Access to these analytics will allow you to take your feelings about certain fields or products during harvest and put real numbers to them. This can be invaluable when making decisions for next year. Having the facts helps guide those decisions so we can make the best possible ones for our operations in the upcoming year.
If you have any questions or want to set up a meeting to learn more, don’t hesitate to reach out! I hope FARMserver and our post-harvest tools will help you evaluate your year and set you up for an even better 2023 season.
Merry Christmas!